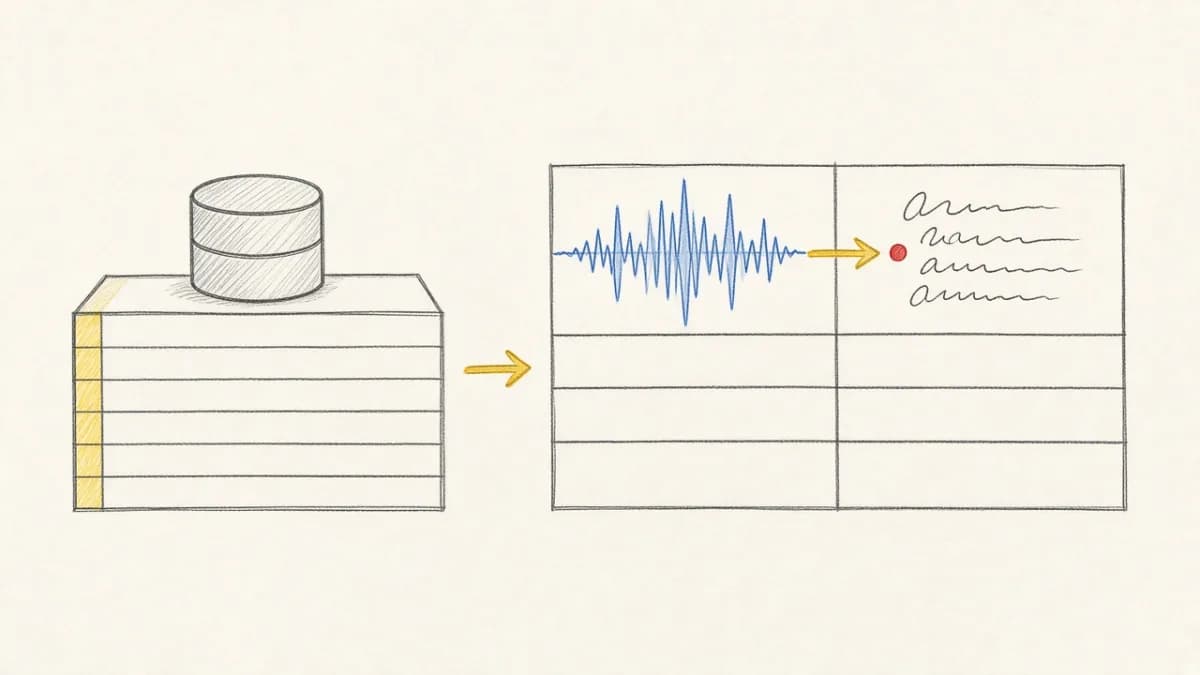
You defined your pipeline in Python: tables, computed columns, embedding indexes, views over video frames or document chunks. Day two is debugging—which rows failed on the vision column, what changed between schema versions, where a view connects to its base table.
Jumping back into a REPL for every question does not scale. The Pixeltable local dashboard is a read-only web UI for exploring catalog data visually. It ships inside the pixeltable package and runs on the same daemon that backs the pxt CLI.
Open the dashboard#
Run one command from any terminal:
This auto-starts the daemon if it is not already running, prints the URL, and opens your default browser. The default address is http://localhost:22089. The daemon survives across shell sessions, so subsequent CLI commands stay fast.
The dashboard binds to 127.0.0.1 only—it is not reachable from other machines on your network. For remote table access, use HTTP Serving with FastAPIRouter and pxt service update.
Override the port with PXT_PORT before any pxt command:
Read-only by design#
The dashboard is an inspector, not an editor. You browse and debug data visually; inserts, schema changes, and rollbacks happen through the CLI or Python SDK. That separation keeps accidental mutations out of a UI meant for exploration.
Pair it with the terminal: use pxt errors and pxt revert from our CLI guide when you need scripted or agent-driven operations; use the dashboard when you want inline media previews and lineage graphs.
Browse the catalog#
The left sidebar shows your full directory tree—directories, tables, views, and snapshots. Each entry displays its kind and error count. Click a table to open it, or click a directory for aggregate stats and child tables.
Press Cmd/Ctrl + K to open global search and jump to directories, tables, or columns by name. Press Cmd/Ctrl + F to focus the in-table row filter.
Inspect table data#
Each table view has three tabs:
- Data — paginated rows with typed columns, sortable by indexed columns, with configurable page sizes. Images, video, audio, and documents render inline.
- Lineage — the table's position in the pipeline: base table, derived views, and column-level dependency graphs.
- History — version list with change types (inserts, updates, deletes) and timestamps.
Above the grid, a collapsible Schema panel shows every column with its type, whether it is computed (with the Python expression), stored vs. unstored, and any embedding indexes.
Filter rows and debug errors#
The filter panel narrows the current page:
- Free-text search across all columns (debounced)
- Faceted filters — text contains, numeric ranges, datetime ranges, boolean/enum checklists
- Errors-only mode — a server-side filter showing only rows where a computed column failed
Errors-only mode is the fastest path to answer "which documents failed embedding and why?" without scanning every row. Failed cells surface the same error metadata you get from pxt errors --json in the terminal.
Preview media#
Images and videos render inline in the data grid. Click any media cell to open a lightbox with keyboard navigation—arrow keys for previous and next. For image-heavy tables, switch to gallery view for a thumbnail grid with a detail overlay per row.
This is especially useful for video pipelines: inspect frame thumbnails from a frame_iterator view, verify captions landed on the right clip, or spot blank frames before re-running expensive model calls.
Explore the pipeline graph#
The Lineage page (sidebar) shows a full-instance pipeline graph. Every table and view appears as a node; edges show base-table, iterator, and query dependencies.
Click any node for a detail drawer with row count, version info, column breakdown, embedding index definitions, computed column expressions, and version history. Use Find table on the canvas to jump to a node and fit it into view.
If you have been reading about Pixeltable's dependency graph, this is that graph rendered interactively—useful for onboarding teammates who do not yet read Python schema files fluently.
Export data and copy SDK snippets#
Download the current table as CSV (up to 100,000 rows) from the table view. Click Copy to generate the Python SDK code for opening the current table—handy when visual inspection turns into scripted analysis.
Troubleshooting#
- Port already in use: set
PXT_PORTto a free port. The daemon refuses to bind twice and the CLI surfaces the error. - Daemon not responding: run
pxt daemon statusfor a health report. If stuck,pxt daemon stopthenpxt daemon start. - Blank dashboard after source install: ensure the React app was built (
npm run buildin thedashboard/directory of the Pixeltable repo).
Keyboard shortcuts#
| Shortcut | Action |
|---|---|
| Cmd/Ctrl + K | Open global search |
| Cmd/Ctrl + F | Focus in-table row filter |
| Esc | Close search, modals, or lightbox |
| Arrow keys | Navigate media in lightbox |